
Easy Searching
Looking for a place to rent? Easily find the perfect match

Learn about living abroad
Read our articles about moving to and living abroad

List Your Property
It's completely free to add your property for rent
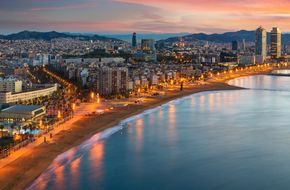
Popular locations
Find a long term rental at one of our most popular locations
- Granada
- La Nucia
- Moraira
- Fuengirola
- Pilar de la Horadada
- Ibiza
- Benitachell
- Velez Malaga
- Costa Del Silencio
- Playa del Ingles
- Elche
- Maspalomas
- Torrox
- Orihuela Costa
- Paterna
- Puerto De La Cruz
- Badalona
- Almoradi
- Torre Del Mar
- Adeje
- Santa Pola
- San Javier
- Puerto Rico
- Finestrat
- Oliva
- Murcia
- San Pedro Del Pinatar
- Cabo Roig
- Sitges
- San Eugenio Alto, Adeje
- Magaluf
- Playa De Las Americas
- San Miguel De Salinas
- Torre de la horadada
- Guardamar del Segura
- San Miguel De Abona
- Fanabe
- Cadiz
- Rojales
- Torrox Costa
- Puerto De Santiago
- Alhaurin el grande
- Ciudad Quesada
- Cullera
- Olocau
- Palm Mar
- Nerja
- Guia De Isora
- Almeria
- Nueva Andalucia
- Algorfa
- Polop
- Chiva
- Golf del sur tenerife
- Golf Del Sur
- L'Eliana
Latest Articles
Covering various topics you may be in doubt about

Schools in Spain: what you should know before moving
Learn about the teaching system of Spain, all the available options regarding school programmes, teaching languages, choosing private or public edu...
Read More

An introduction to the healthcare system of Spain
Spain is a country with a long tradition for free, high quality public healthcare. Learn who are covered by the public system and the price level o...
Read More
Living in Spain for 6 months with a winter rental
Moving to Spain for the winter months is an ideal solution for pensioners, digital nomads, freelancers, and anyone else who is not confined - for w...
Read More